 |
How to Represent RNA Trees as Planar Graphs
| Home
RNA Tree Graph Subproject Home
Database of RNA Trees
|
RNA tree graphs convey the connectivity of secondary elements.
These secondary elements include junctions,
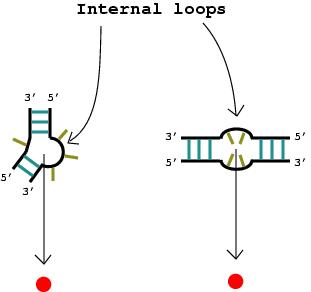
internal
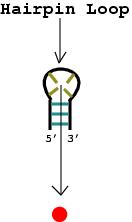
loops, hairpin loops,
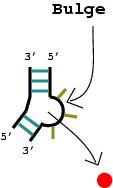
bulges, and stems.
|
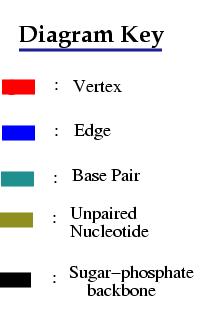
The following explains how tree graph edges
(blue) and vertices (red)
are assigned:
1. A nucleotide bulge, hairpin loop, or internal loop is considered a vertex (denoted by the solid red circle) when there is more than one unmatched nucleotide or non-complementary base pair.
|
|
 |
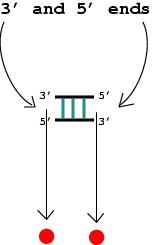
2. The 3' and 5' ends of a helical stem are considered vertices.
 |
3. A junction is a vertex (denoted by the solid red circle).
 |
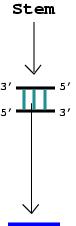
4. An RNA stem with more than one complementary base pair is considered an edge (denoted by the blue line).
 |
We emphasize that these simplified tree graphs only model topological,
rather than geometric, aspects of RNA molecules; for example, they do not
tell us the relative angles between stems. By matching the graphs
to real RNAs, we can infer the average length of stems, the average size
of junctions and the average number of nucleotides in loops and bulges.
For example, an edge represents a stem of about 20 nucleotides (nt).
Thus a four-edge graph for tRNA corresponds roughly to an 80 nt. RNA.
The following shows how these rules are applied to generate an RNA tree graph:
Example of a 5S rRNA (S73542):
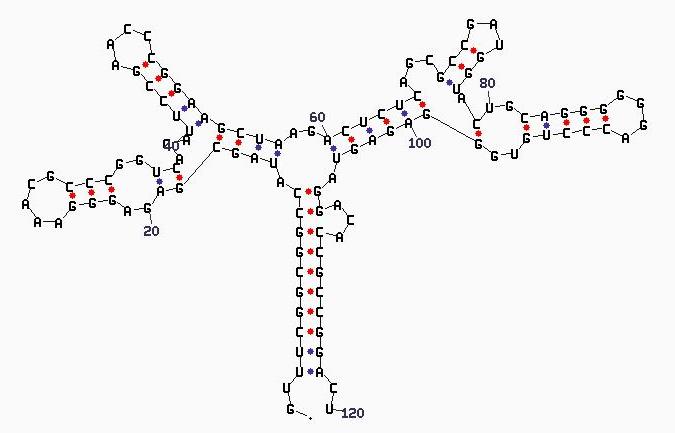 *Diagram Key does not
apply to structure above Corresponding tree graph: 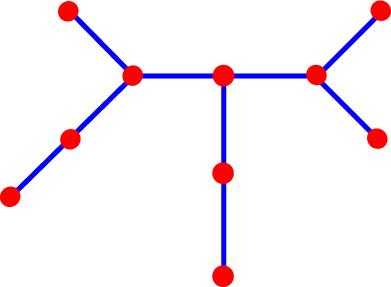 |