Spectral Graph Analysis
The topological properties (e.g.,
patterns of connectivity) of graphs can be analyzed using spectral graph
theory. Each RNA graph has a Laplacian matrix representation and a corresponding
eigenvalue spectrum (see Graph Isomorphism);
the number of eigenvalues is equal to the rank of the matrix. The eigenvalues
are related to the connectivity pattern (or topology) of the RNA graph.
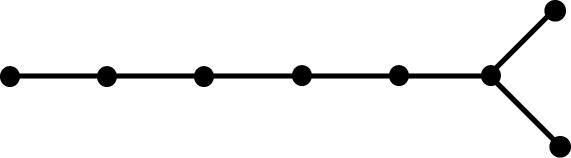
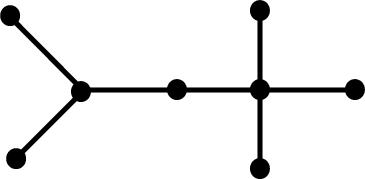
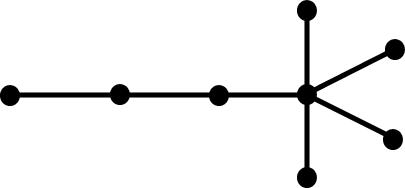
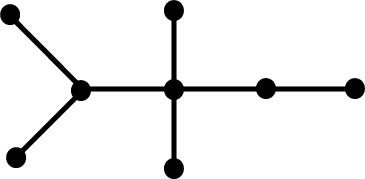
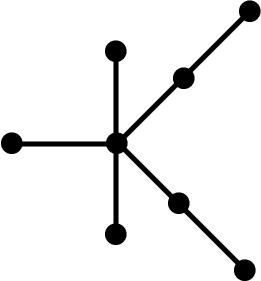
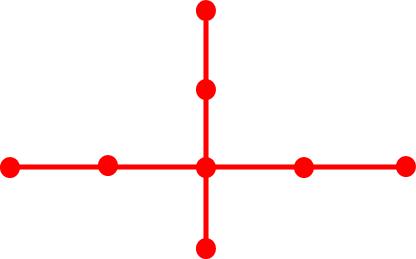
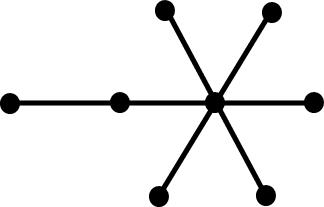
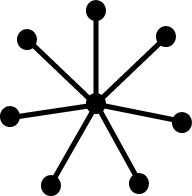
In particular, the second smallest eigenvalue is a measure of the compactness
(more precisely, algebraic connectivity) of a graph. A large second eigenvalue
indicates a compact graph, whereas a small eigenvalue implies an elongated
topology. The following tree graphs illustrate the relationship between
second Laplacian eigenvalue and graph structure. (Note that only the eigenvalues
of graphs with the same number of vertices can be meaningfully compared.)